
"Anything that changes your brain’s evaluation of danger will change pain."
Professor Lorimer Moseley
Professor of Clinical Neurosciences and Foundation Chair at the University of South Australia
OldPain2Go In House Study
Investigations into reduction in pain perception:
An Analysis of Subjective Client Feedback Data following one OldPain2Go® Treatment
Abstract:
OldPain2Go® is a non-pharmacological intervention that aims to remove chronic pain by addressing thought processes. In this study, we present an analysis of subjective feedback data collected from 216 clients who participated in training and demonstration events between November 2016 and March 2019. The feedback forms assessed the clients' perception of pain levels before and after one session of OldPain2Go®, using the Subjective Units of Distress Scale (SUDs). The results indicate that a majority of clients perceived no pain or experienced a reduction in pain after the session, highlighting the potential efficacy of OldPain2Go® as an alternative to a pain management approach.
Introduction:
Chronic pain affects a significant portion of the global population, necessitating effective and non-pharmacological pain management approaches. OldPain2Go® is a novel intervention that targets thought processes to alleviate chronic pain. The methodology works on the effectiveness of the power of the Placebo effect and the removal of any Nocebo effect alongside the natural ability of the body to heal when the thing process that is stopping it is removed and any other other factors that are raised. These are genuine and powerfull effects that are real and scientifically valid, but somewhat misunderstood. Therefore blind or double-blind studies are not feasible for this intervention, as they are designed to remove any possibility of a placebo affect (so as not to attribute it to a drug, when testing them). This analysis was conducted on subjective feedback data obtained from various events to evaluate the effectiveness of OldPain2Go® in reducing pain perception.
Methodology:
The data analysed in this study were collected from 216 clients who volunteered at training and other events conducted by the creator of OldPain2Go®, Steven Blake, or by a newly trained practitioner (about 50/50). The client volunteers were assessed via telephone to ensure they met specific criteria, including a medical diagnosis, a desire to be pain-free, and suitability for either a newly trained practitioner or the trainer himself. All sessions were provided totally free of charge. The clients' self-reported pain levels were evaluated using the Subjective Units of Distress Scale (SUDs) before and after one session of OldPain2Go®. This scale measures percieved pain, as pain is unique to each individual and there is no scientific method of accurately measuring pain levels.
Results:
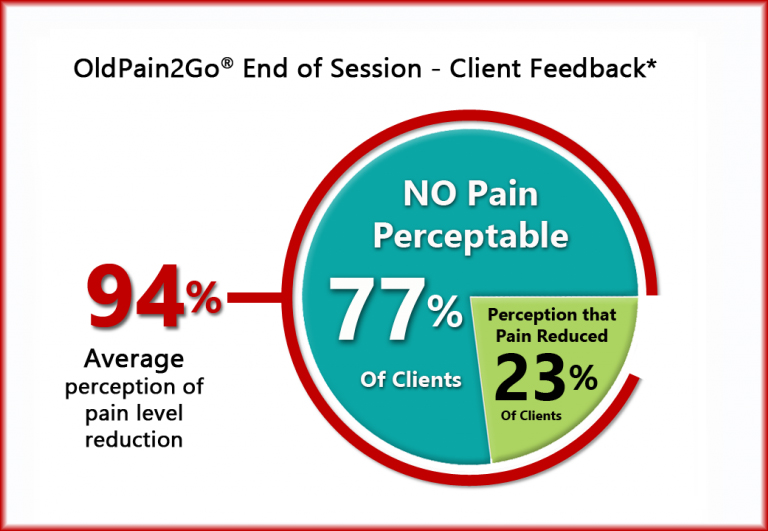
Out of the 216 clients, 167 clients (77.31%) reported zero pain at the end of the session, while 49 clients (22.68%) perceived a reduction in pain. Zero clients reported no change or a higher end SUDs score. The overall reduction in perceived pain across all 216 clients was 1,323 start units and 77 end units an average reduction of 94.179%.
Breakdown of Data Subset:
On further analysis, the 49 clients who still perceived some pain at the end of the session recorded a total of 327 units of pain at the beginning (average start score of 6.6 per person) and 77 units at the end (average end score of 1.57 per person). This group experienced an average reduction in pain of 76.45%.
Discussion:
The analysis of subjective feedback data from training and demonstration events suggests that OldPain2Go® may be effective in reducing perceived pain levels. The majority of clients (77.31%) reported no pain at the end of the session, a 100% reduction, while 22.68% experienced an average 76.45% reduction in pain. These findings indicate a potential benefit of OldPain2Go® as an alternative to pain management techniques for some individuals.
Limitations:
It is important to acknowledge the limitations of this study, primarily stemming from the lack of a control group and the subjective nature of the data. The absence of blind or double blind designs may introduce bias, and individual variations in response to OldPain2Go® could impact the overall outcomes. This was not a planned data collection just an adhoc analysis of data collected.
Conclusion:
This analysis of subjective feedback data from events suggests that OldPain2Go® has the potential to alleviate chronic pain by addressing thought processes. The results indicate that a significant number of clients perceived no pain or experienced a reduction in pain after one session of OldPain2Go®. Further research, including controlled trials, is warranted to corroborate these findings and establish OldPain2Go® as a viable alternative for pain management.
Update: When a comparison was made between the results of the clients who were worked on by Steven Blake the creator of the Methodology and those worked on by someone who had completed their training in OldPain2Go® just that day, it showed on average only 2% lower outcomes than Steven's work. Whilst not a definative statement it does indicate that it is the methodology that works and isn't reliant on skill, experience or any authority effect.
Some people going through a long treatment process could get better by just by chance during that duration. As the average length of the one session each client had would have been less than one hour and as the average length of having the pain was over 10 years these results cannot be put down to any coincidence of timing.
Keywords: chronic pain, OldPain2Go®, pain removal, subjective feedback, Subjective Units of Distress Scale (SUDs), non-pharmacological intervention.
External Independent Study - Teesside University
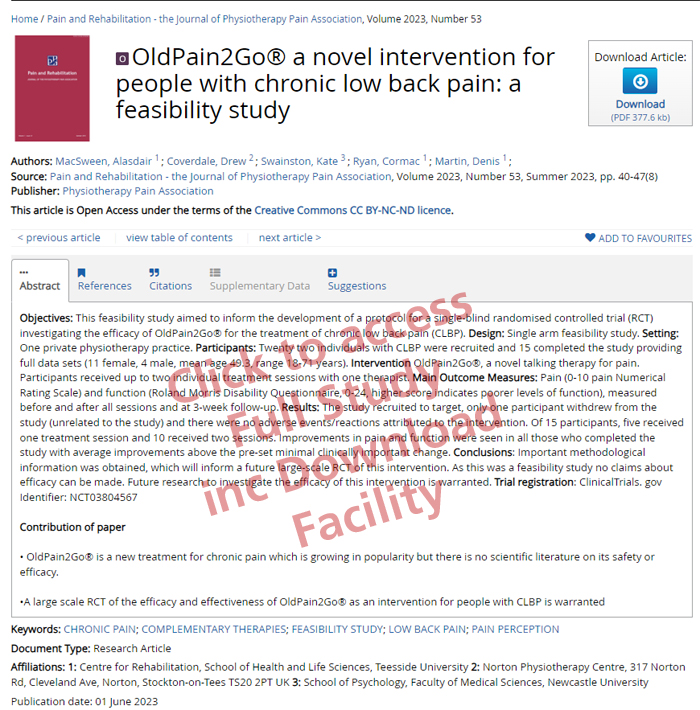
OldPain2Go® a novel intervention for people with chronic low back pain: a feasibility study
Extract: "All participants who completed the study reported improvements in both pain and function. The magnitude of the improvement, both immediately post treatment and at the 3 week follow up point, were well above the MCID and the effect sizes reported were large for both measures. Given the tendency for small studies to demonstrate overly inflated effect sizes these findings should be interpreted cautiously. It is particularly promising to see these improvements occur within a relatively brief period of time and relatively short duration patient contact time of one hour per treatment session. This has potential implications for service provision where resources are continually over stretched and provides justification for further exploration of this novel intervention. These results demonstrate the feasibility and safety of recruiting to and delivering OldPain2Go®, for the treatment of pain and function, in people with CLBP [Chronic Lower Back Pain] within a research setting."

